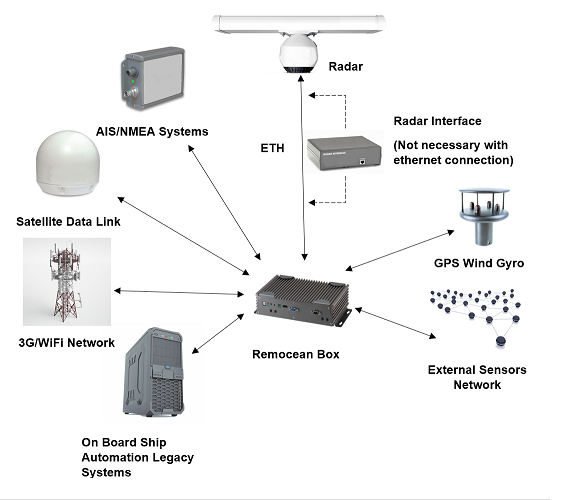
The Remocean Coastal Monitoring system is one of the Remocean applications based on its innovative radar data analysis algorithm. The Remocean Coastal Monitoring system represents an integrated solution for coastal monitoring, providing real-time information on the state of the sea, on the field of surface currents and on the bathymetry of the seabed. The application provides real-time information (within a radius of up to 3 nautical miles from the radar) on: • State of the sea : – direction, length and period of primary and secondary waves; – significant wave height; • Surface currents : high resolution interactive map of the surface current field on google map type cartography; • Directional spectrum : 2D representation of waves in the frequency domain; • Wave elevation propagation : space-time reconstruction of waves; The system also allows you to view the high definition radar image superimposed on an interactive map on Google Map type cartography. The information provided by the Remocean Coastal Monitoring system is extremely useful for the study of coastal dynamics and, to understand the causes and effects of coastal erosion and the interactions (reflection, refraction and diffraction) of waves with coastal infrastructures .
Technical specifications
Wave and Current parameters
Accuracy
Range
Resolution
Significant Wave heigt(Hs)*
+/- 10%
0.3 + 25m
0.1 m
Peak direction*
+/- 2°
0 - 360°
1°
Peak period*
+/-0.4 s
3 – 30s
0.1s
Peak wave lenght*
+/-10%
15 – 600m
1m
Current speed*
+/-0.1 m/s
0 – 20 m/s
0.01 m/s
Current direction*
+/- 2°
0 – 360°
1°
Wave Spectra
Accuracy
Range
Resolution
2D direction frequency spectrum*
0.02 – 0.35 Hz 0°-360°
0.005 Hz/4°
1-dimensional frequency spectrum*
0.02 – 0.35 Hz
0.005 Hz
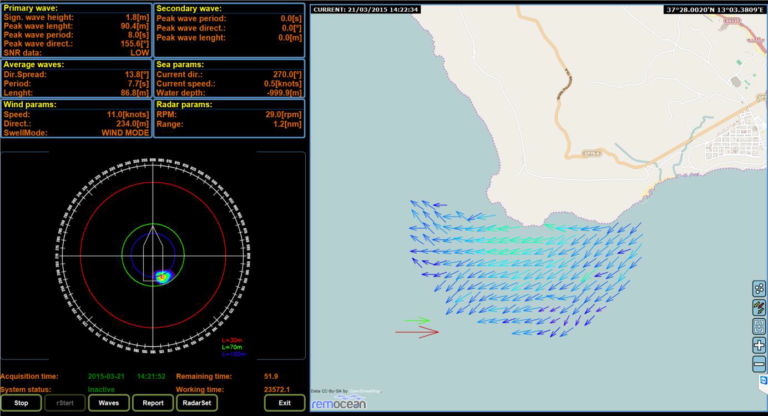
User interface
The system user interface has the following three main components:
Data area : this area shows, in real time, all the data relating to the measurements of the state of the sea (significant wave height, period, length and direction of the dominant waves);
Directional Spectrum Area : Shows the directional spectrum of the waves.
Surface currents map : the right side of the user interface is entirely dedicated to the surface currents map superimposed on Google cartography.
The system is natively configured to allow data transmission to a remote server in order to allow system users to access the web interface and see data updates in real time even from a smartphone .
Remocean Coastal Monitoring System user interface (GUI) example